Showing posts with label Memory Management. Show all posts

Tuesday, September 23, 2014

Garbage Collection in Java

Unlike C Language, the Java allocates and de-allocates the memory automatically. De-allocation is done by garbage collector. In this post, we focus on the de-allocation (Garbage collection). Automatic garbage collection is the process of identifying the objects which are in use, then remove the unused objects and compact the memory.

The garbage collection is done by phases
  • Mark: This is the process of identifying the objects which are in use and which are not
  • Sweep: De-allocating the objects which are not in use.
  • Compact: This is to improve the performance of allocation and de-allocation. After de-allocation, the objects may spread across the memory. The compact phase brings all the referenced objects together to create the empty space at one side.
Next question that rises is, how GC knows which objects are live. If there is a reference to the still open, then it is classified as Live object (Reference Object as in the picture). Reference means referred by the program or referred by the other memory unit (Like objects in Young generation may referred by the objects in Old generation). In this case, Old generation has a fixed memory length called "card table". This card table contains the reference of the objects in Young generation which are being referred by Old generation, then GC just looks at the card table to determine the Live Object reference from Old Generation.

Garbage Collectors

There are few types of garbage collectors which are evolved over the time.  

Serial GC

Serial GC is a very old GC which can be used with the machines with single CPU. It pauses the application while going through the phases of Mark, Sweep and Compact. This GC is not performant, so may result in loosing the throughput of the application. This is the default GC on all the single CPU machines. 
Command line flag for using this GC is -XX:+UseSerialGC

Parallel GC

As the name indicates, multiple GC threads runs during the garbage collection. The number of threads created for garbage collection are equal to the number of CPUs. If there is only one CPU, its equal to the Serial GC. The number of threads can be controlled using the command line switch : -XX:ParallelGCThreads=<no_of_threads>. It's also called as "Throughput GC" as the garbage collection is done in parallel. 
The command line switch to enable the GC is : -XX:+UseParallelGC. By default, parallel threads are created for Young Generation GC, but only one thread for Old Generation GC. If we would like to add multiple threads for the Old Generation, use the command line switch : -XX:+UseParallelOldGC to enable Parallel GC with Multiple Old Generation threads (This to be used independently, not in conjunction with Parallel GC)

CMS Collector

Abbreviated to Concurrent mark sweep collector. It doesn't have an option to compact the memory after sweeping. Moreover its runs in parallel with application thread(s). 
It goes through the following phases
  • Initial Mark: First marks the objects which are very close to the class loader so the pause time of the application will be very small. 
  • Concurrent Mark: The objects referenced by the surviving objects that have just been confirmed are tracked and checked.
  • Re-mark: This step re-checks the objects which are marked in Concurrent Mark.
  • Concurrent Sweep: Here, the un-referred objects are collected to complete the garbage collection process.
Points to remember
  • All the steps runs in parallel with the application threads except "Initial Mark" step
  • After Sweep, no compaction is done to bring all the live objects together. To allocate the bigger objects in this GC, allocate more Heap because memory may not be sufficient as compaction is not done
  • This GC is used with time critical and performance required applications. 
The command line option to request the GC is : -XX:+UseConcMarkSweepGC

G1 GC

G1 GC is officially released with Java7. It was also there in Java6, but for only test purpose. In the process of the G1 Collector, we don't see the memory moving from Young to Old Generation. As shown below, the memory is allocated in blocks. Once block is full, the memory is allocated in the next block and GC will run. This is full time replacement for the CMS Collector. G1 is faster than any other type of GCs we have seen so far.

The command line to enable the GC is : -XX:+UseG1GC. To read more about G1 GC, follow the link

Happy Learning

Monday, September 15, 2014

Java Heap Memory

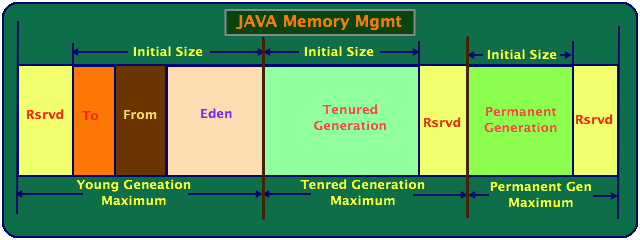
This is continuation of the previous post. As i mentioned earlier, the Java Memory is divided into multiple generations for the performance of JVM as explained below.
  • Permanent Generation
  • Old or Tenured Generation
  • Young Generation


Each of the above spaces (with minimum and maximum values) can be configurable through the command line parameters. If not configured, JVM defaults each of these based on the mode of JVM and the platform running. Initial size is the size allocated during the startup of JVM irrespective of the usage of the application and the remaining size will be reserved. When application is running out of the initial size, then it starts using the remaining space until the the maximum size is reached. Once the size reached maximum and memory can't be allocated, it throws an OutOfMemoryError exception. The total size of the heap is configured using
  • -Xms: The minimum size of the heap space
  • -Xmx: The maximum size of the heap space

Permanent Generation

Permanent generation is the part of the heap memory where the class meta data and string constants are stored. This is also one of the space which is garbage collected. Most of us (including me) think that Permanent generation is created and never GCed. GC will run on the permanent generation when there are no references on the constants or the constants are never used. The Permanent Generation space is configurable using the following two parameters
  • -XX:PermSize: Initial permanent generation size during the start of VM.
  • -XX:MaxPermSize: This is the maximum size of the permanent generation which can be expanded up-to from initial size.

Old Generation

As the name indicates, this is the pool of the objects which are survived during the full GCs. These are the objects copied from the survivor spaces (Will see this very shortly). The size of the old generation is always relative to the young generation. The parameters will be explained in conjunction with Young Generation

Young Generation

The new objects are always created in the Eden space of the Young Generation. When GC happens, the objects which are survived will be moved to the Survivor space 1 (From). Subsequently, the objects survived in the From Survivor Space will be moved to To Survivor Space. So, in short the objects are initially created in Eden and survived objects will be moved to From and To Survivor spaces and Eden space is cleared to create more new objects.
The size of the survivor space can be set relative to the Eden Space using the option -XX:SurvivorRatio. The sizes of two survivor spaces will be same. So, if we set-XX:SurvivorRatio=6, each survivor space will be one-eight of the young generation and Eden will be six-eight. 
The parameters -XX:NewSize and -XX:MaxNewSize are the initial and maximum sizes of the Young generation. The ratio between Young and Old generation is set using -XX:NewRatio. If we set -XX:NewRatio=3, then the total young generation (both Eden and Survivor space) will be one-third of the total heap size. 

Command line parameters

  • -Xms size: The minimum size of the Heap Space.
  • -Xmx size: The maximum size of the Heap Space.
  • -XX:NewSize=size: The initial size of the Young Generation.
  • -XX:MaxNewSize=size: The maximum size of the Young Generation.
  • -XX:SurvivorRatio=ratio: The ratio between survivor space and the Eden space.
  • -XX:NewRatio=ratio: The ratio between Young and Old Generations.
  • -XX:+AggressiveHeap: This parameters let the JVM to allocate the as much space as possible until the space is available on the machine. This is one of the GC tuning option to be set for long running programs. (May be for the application servers).

Points to remember

  • If the NewRatio is high, then the time between full GCs will be more
  • If the survivor spaces are tool small, then the objects will be directly moved to Old Generation without using the Survivor in case of Large objects.
  • The young and old generations are always related to minimum and maximum sizes of the Heap. 
In the next post, we will see more details on the GC and moving objects between different generations.

Happy Learning!!!!

Saturday, September 13, 2014

Java Memory Management - Overview

JVM creates various run time areas during the startup for the execution of the program. The following figure illustrates the memory model used by JVM.

JVM creates

  • Method Area
  • Native Method Stack
  • Java Stack
  • pc Register
  • Heap Space


Method Area

Method area is the space where the compiled code of all the JVM Threads contain. It stores the data common to all the threads like methods, constructors of each class, common run time variables etc. Its very similar to  Heap memory but this area couldn't get compact or clean up during the garbage collection. It is created during the startup of JVM.
  • If area is not able to allocate the request, then JVM throws an OutOfMemoryError.

Native Method Stack

This area is used to support the conventional native methods for invoke operation. This memory is for the methods written in other than Java. This area is created by the creation of the Thread.
  • If native methods require a large amount of stack than supplied, it raises StackOverflowError
  • If memory can be extended but couldn't able to allocate, it raises OutOfMemoryError

Java Stack

In other words, its JVM private method stack. This is same as Conventional method stack but used for only methods created in Java.
  • If methods require a large amount of stack than supplied, it raises StackOverflowError
  • If memory can be extended but couldn't able to allocate, it raises OutOfMemoryError

pc Register

As Java can execute multi-threads, each thread has it's own pc register to store the current instruction being executed by the thread. It contains the value only the thread is executing a non-native instruction. If the thread is executing a native instruction, it will be undefined.

Heap

Heap is the common run time work area for all the threads. It stores the local variables, collections, objects data being used by the each thread.  The reclaimed objects will be collected/removed by the automatic memory management process called Garbage Collector. The head size can be fixed by using the command line parameters otherwise it's not limited (depends on the system where the JVM is running).
To increase the performance of the JVM, the heap is divided into multiple generation as you see in the above picture. So Heap is divided into Young generation and Old or Tenured Generation and Permanent Generation. 

PermGen Space

PermGen space will be used by JVM to keep the loaded class and other common spaces like String pool. This space is directly proportional to the size of the application (classes, strings created etc.) and also GC cannot do much clean-up on this, so it will easily run out of memory with PermGen out of space error if not defined properly. 

Heap and PermGen space can be configurable using command line arguments while starting the JVM. In the next sections, will see more details on the Heap Memory, PermGen Space and Garbage Collector and their settings.